How can we build a scalable and customizable Geospatial Data Collection System that uses open-source tools?
Role
As Product Designer, I led the development of Terra’s design system using Atomic Design principles–from foundational elements (color, typography, spacing) to components (buttons, checkboxes) and patterns (modals). I defined component guidelines and specs to ensure consistency and improve team efficiency across a multi-designer workflow. As a team member, I led a Design Sprint, and contributed to defining the product’s strategy.
Timeline
Sep 2023 – May 2024
Overview
Our client – the iConsultancy at UMD – want to expand their provided service by developing a Geographical Information System (GIS) field data collection mobile application to map and collect geospatial data. The system needs to be scalable/customizable to serve multiple use cases and intuitive to serve a wide range of users. We have created 2 platforms serving 2 target user groups:
Data Collection Mobile App for the Field Data Collectors
Data Admin Desktop Portal for the Project Owners
Team
Jamie Dinh – Product Designer
Amit Gaikwad – Product Designer
Kalyan Chandana – Product Designer
Daiyi Peng – UX Researcher
Yunbin Bae – UX Researcher
Tools
Figma
Miro
Whimsical
Design Sprint Methodology
Scope
Product Strategy, UX/UI, Wireframes, Prototype, User Interview, Usability Testing
Project goal
How can we build a customizable and accessible two-platform geographic data collection system using open-source tools as an additional provided service of the iConsultancy?
Platform #1: Web-based Project Admin
A Project Admin Portal for the Project Owners to set up field data collection project based on project requirements
Platform #2: Field Data Mobile App
A Field Data Collection mobile app to go on field and collect location data using the app set up by Project Owners
Why two-platform?
While providing a single app for both user groups offers a compact solution and is great for on the field changes, our chosen two-platform approach enables a more specialized and efficient workflow. A mobile field data application offers an on-the-go solution for data collectors that is accessible anywhere in the field. Meanwhile, a web-based project admin portal simplifies the workflow for project owners and provides powerful customization options.
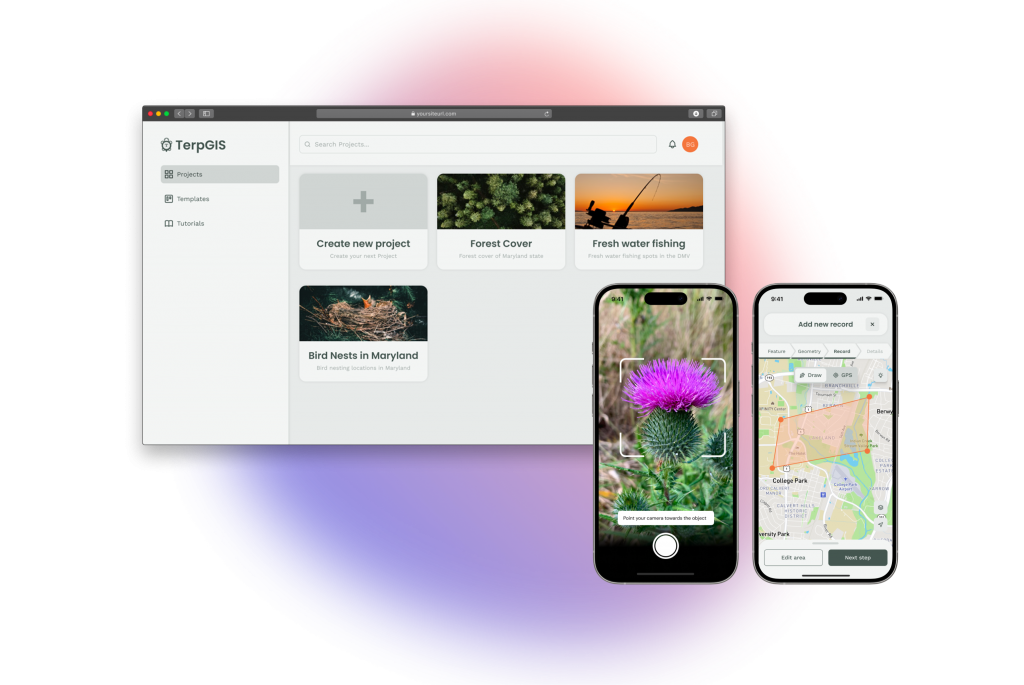
The Geospatial Data Collection System
TerpGIS is a field data collection and data management platform that built for professionals work in the field. The system includes a web-based Data Admin Portal and a Field Data Collection mobile application.
Key feature #1
Admin Portal for project set-up
An Admin Portal that allows Project Admins to set up and customize the Field Data Collection mobile app.
3 panel form-customization dashboard
Pop-up Library of input elements to select from
Form adjustments with live preview
Key feature #2
Draw and Live Record geospatial data
The Field Data Collection mobile app offers the ability to draw or GPS live record a geometry on map (line, or polygonal). The geospatial data will be mapped and submitted to the database.
Key feature #3
Tutorial and Hints
Just-in-time Onboarding that can be reaccessed.
Dedicated Tutorials Section accessible right from Project Home screen
Hints as contextual help during major user flows
Making initial assumptions
While data is important, we understand that it might take time to reach a point where we have sufficient data to fully support our decision. We chose Design Sprint Methodology as our early approach to make assumptions and validate them.
Why Design Sprint?
Design Sprint is an exclusive 5-step methodology for validating ideas and tackling big challenges by rapid prototyping and testing ideas with users. As we were at the initial stage of the project without any existing products, employing a Design Sprint is essential for us to promptly validate our ideas before investing time and effort.
2 Design Sprints were conducted throughout the time span of 2 months, each Design Sprint was used to target each platform: Project Admin Portal and Field Data Collection App.
Source: The Sprint Book by Jake Knapp
Sketching & Wireframing
Each team member sketched out their ideas and we as a team decided on which one to pursue further. Once we settled on the final concepts, we rapidly developed wireframe prototypes ready for testing with users in the field.
What need to be fixed?
We discovered that our design was excessively complex, departing from industry standards and lacking sufficient onboarding or guidance.
Iteration #1
Adding guidance system
Tips to design an onboarding/guidance system:
Excessive onboarding can be annoying as it disrupts the user’s workflow
Offer options to recall guidance whenever necessary
Allow for opt-out of guidance/onboarding process
Break down complex tasks into clear, actionable steps
Iteration #2
Simplify screens and work flow
We opted to compromise a shorter user flow for a simpler and more minimalist design. This choice means fewer on-screen elements and more taps to access functions, but it is more important for our users segment that we prioritize clarity and simplicity.
Iteration #3
Adhere to current standard while introducing our new selling point
“Typically I just click on the map and I can add a point, and this isn’t as intuitive”.
We realized that simply introducing a new feature to the field might not be easy and could lead to user rejection. To mitigate this risk, the product should adhere to the current industry standard by default and gradually introduce the new feature, facilitating a smooth transition for users.
Building a Design System
After multiple iterations, we started to define the visual language, covering branding, color, typography, and comprehensive design guidelines. We aim to foster scalability with the Design System.
Specs
Each component comes with a specs specifying the padding, spacing, and typography token. These information will help software engineers to easily grab the information for faster development process.
Component guidelines
Each component also comes with a UX guidelines specifying how the component should/shouldn’t be used. This will ensure consistency across the products when it scale up and have a larger design team.
What have I learnt?
Assumptions in decision making
During the design process, assumptions are unavoidable. It might be hard to reach a point where we have sufficient data to fully support our decision. Instead, it’s better to make the decisions, document our assumptions, and validate them later in the process.
Flexibility is key
Flexibility is crucial in both team roles and work approaches. While I was initially designated as a Product Designer, I often found myself taking on other roles such as researcher, facilitator, or product manager as needed during the project. Although we initially opted for the Design Sprint methodology, we discovered that we didn’t always have to stick to the exact same process. I came to realize that the ability to adapt to different contexts is key to being a valuable team player.
The client is your user
It is not always straightforward working with the client and articulating the design decisions. I learnt to understand the client’s personal preferences, speak their language, and adapt to their working style.
Index #1: Initial research to define problems
Insight #1
Customizability and Usability is a challenge
Through competitor analysis and heuristic review, we scored each product base on their customizability and usability. The analysis indicated that many apps, while having solid core features, are providing limited customization options to meet different project requirements. Furthermore, we found out that there is still room for improving usability.
Insight #2
A hidden user group!
We mapped out the basic workflow for GIS data collection based on insights from expert interviews. The flow involves two main user groups:
Project Owner: who set up and customize the data collection form base on project requirements.
Field Data Collector: Volunteer or science-citizens who uses the data collection form to collect data on field.
Insight #3
Open-source vs. Enterprise License
While non-profit organizations (NPO) favor open-source tools due to budget limitations and the need for customization, academic/commercial entities prefer licensed software for stability, support, and comprehensive features.
Given that the majority of iConsultancy’s current clients are NPO, we opted to utilize free and open-source tools.
Index #2: Running the Design Sprint
How Might We…
We started out the Design Sprint by defining the goals for each platforms, and settled down the “How Might We” after several rounds of voting with the client:
Mapping & Storyboarding
We outlined the business flow to understand where our solution fits into the larger picture. Following that, we created a storyboard to ensure everyone was aligned on the flow before proceeding to sketching.
Map out business flow
Storyboard
Sketching & Wireframing
Each team member sketched out their ideas and we as a team decided on which one to pursue further. Once we settled on the final concepts, we rapidly developed wireframe prototypes ready for testing with users in the field.
The sketches
Sketch voting
User Testing & Contextual Inquiry
Throughout the process of building and testing prototypes, we intermittently conducted contextual inquiries with our target users. We organized the insights gained from these interviews into affinity diagrams and mindmaps, enabling us to effectively address various user pain points within our functionalities.